A CI pipeline tells you whether the last run passed. It does not tell you whether the suite is getting less stable, which area of the product fails most, or whether a release is safer than the one before it. Those answers live in the history of your test results, spread across frameworks, teams, and pipelines.
I have built this kind of centralized quality-observability platform for a distributed system, and the pattern is simple: publish every test result to Elasticsearch, then explore it in Kibana. This article shows how, using the Playwright and Pytest suites from my previous articles on Playwright and infrastructure testing.
Why Go Beyond Pass/Fail?
Dashboards over test history help you answer questions that a single run cannot:
- Is quality trending up or down? A pass-rate trend over weeks shows slow decay that no single red build reveals.
- Which tests are flaky? A test that fails and then passes on retry erodes trust. Counting them makes the problem visible.
- Where do failures cluster? Failures by layer (UI, API, infrastructure), application, or error type point you at the real problem area.
- Is this release healthy? Comparing pass rate and failures per pipeline gives release managers evidence rather than a feeling.
The Architecture
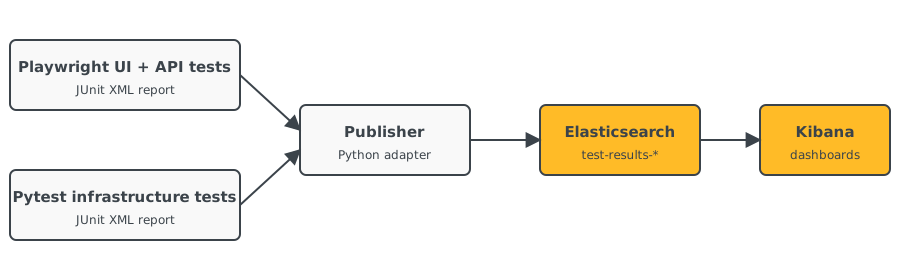
Each test framework already produces a report. A small publisher converts those reports into documents and bulk-indexes them into Elasticsearch. Kibana reads the index and renders the dashboards. Nothing in the test code needs to change.
Try it locally
To experiment, run a single-node Elasticsearch and Kibana with Docker Compose. Use the same version for both, and check Elastic's documentation for the current release. This configuration turns security off, so use it on a local machine only.
# docker-compose.yml (local experiments only)
services:
  elasticsearch:
    image: docker.elastic.co/elasticsearch/elasticsearch:8.15.0
    environment:
      - discovery.type=single-node
      - xpack.security.enabled=false
      - ES_JAVA_OPTS=-Xms512m -Xmx512m
    ports:
      - "9200:9200"

  kibana:
    image: docker.elastic.co/kibana/kibana:8.15.0
    environment:
      - ELASTICSEARCH_HOSTS=http://elasticsearch:9200
    ports:
      - "5601:5601"
    depends_on:
      - elasticsearch
Kibana is then available at http://localhost:5601.
Designing the Result Document
The most important decision is the shape of one document. I index one document per test result, with
enough context to slice the data by application, layer, environment, branch, and run. Use keyword
fields for anything you will filter or group by.
| Field | Purpose |
|---|---|
@timestamp | When the result was published, used for trends |
run_id | The pipeline run, used to compare releases |
application, environment | What was tested and where, for example summit-trust-bank and qa |
framework, layer | The tool and the kind of test: ui, api, or infra |
branch, commit_sha | Source context for each result |
test.name, test.suite | Which test produced the result |
status | passed, failed, or skipped (and flaky where available) |
duration_ms | Runtime, for spotting slow tests |
error.type, error.message | Failure details, for grouping by cause |
Define the mapping up front with an index template, rather than letting Elasticsearch guess. Run this in Kibana's Dev Tools console:
PUT _index_template/test-results
{
  "index_patterns": ["test-results-*"],
  "template": {
    "settings": { "number_of_shards": 1 },
    "mappings": {
      "properties": {
        "@timestamp":  { "type": "date" },
        "run_id":      { "type": "keyword" },
        "application": { "type": "keyword" },
        "environment": { "type": "keyword" },
        "framework":   { "type": "keyword" },
        "layer":       { "type": "keyword" },
        "branch":      { "type": "keyword" },
        "commit_sha":  { "type": "keyword" },
        "status":      { "type": "keyword" },
        "duration_ms": { "type": "long" },
        "test": {
          "properties": {
            "name":  { "type": "keyword" },
            "suite": { "type": "keyword" }
          }
        },
        "error": {
          "properties": {
            "type":    { "type": "keyword" },
            "message": { "type": "text" }
          }
        }
      }
    }
  }
}
I write to monthly indices such as test-results-2026.10. That keeps indices small and makes it easy to
delete old data later.
Publishing Results from CI
The publisher reads a JUnit XML report, builds one document per test case, and bulk-indexes them using the official
Python client (pip install elasticsearch). Playwright and Pytest can both write JUnit XML, so one parser
covers both.
# reporting/publish_results.py
from __future__ import annotations

import os
import sys
import xml.etree.ElementTree as ET
from datetime import datetime, timezone

from elasticsearch import Elasticsearch, helpers


def parse_junit(path: str):
    """Yields one document per test case in a JUnit XML report."""
    for case in ET.parse(path).getroot().iter("testcase"):
        # Elements with no children are falsy, so compare with None explicitly
        problem = case.find("failure")
        if problem is None:
            problem = case.find("error")

        if problem is not None:
            status = "failed"
        elif case.find("skipped") is not None:
            status = "skipped"
        else:
            status = "passed"

        doc = {
            "test": {"name": case.get("name"), "suite": case.get("classname")},
            "status": status,
            "duration_ms": int(float(case.get("time", 0)) * 1000),
        }
        if problem is not None:
            doc["error"] = {"type": problem.get("type"), "message": problem.get("message")}
        yield doc


def main(framework: str, layer: str, report: str) -> None:
    now = datetime.now(timezone.utc)
    run_id = os.environ.get("CI_PIPELINE_ID", f"local-{now:%Y%m%d%H%M%S}")
    meta = {
        "@timestamp": now.isoformat(),
        "run_id": run_id,
        "application": "summit-trust-bank",
        "environment": os.environ.get("TARGET_ENV", "qa"),
        "branch": os.environ.get("CI_COMMIT_REF_NAME"),
        "commit_sha": os.environ.get("CI_COMMIT_SHA"),
        "framework": framework,
        "layer": layer,
    }
    index = f"test-results-{now:%Y.%m}"

    # A deterministic _id makes re-publishing the same run idempotent
    actions = (
        {
            "_index": index,
            "_id": f"{run_id}:{framework}:{doc['test']['suite']}:{doc['test']['name']}",
            "_source": {**meta, **doc},
        }
        for doc in parse_junit(report)
    )

    es = Elasticsearch(
        os.environ.get("ES_URL", "http://localhost:9200"),
        api_key=os.environ.get("ES_API_KEY"),
    )
    indexed, _ = helpers.bulk(es, actions)
    print(f"Indexed {indexed} results into {index}")


if __name__ == "__main__":
    main(*sys.argv[1:4])
The CI_* variables are GitLab CI's predefined variables, so the same script adds pipeline and commit
context in CI and falls back to a local run ID on a laptop. Run it from a job that always executes, even when
tests fail, because failed runs are the most interesting data:
publish-results:
  stage: report
  image: python:3.12-slim
  when: always
  needs:
    - job: playwright
      artifacts: true
    - job: infra-tests
      artifacts: true
  script:
    - pip install elasticsearch
    - python reporting/publish_results.py playwright ui test-results/junit.xml
    - python reporting/publish_results.py pytest infra results/junit.xml
That is a sketch, so adjust the job names and artifact paths to your pipeline. Set ES_URL and
ES_API_KEY as masked CI/CD variables.
Detecting flaky tests
JUnit XML does not describe retries well, so it cannot tell you reliably that a test failed once and then passed.
For flakiness, use a richer source. Playwright's JSON reporter, for example, marks each test as
expected, unexpected, flaky, or skipped. Map that to the
status field in your adapter, and the flaky-test panels below start working.
Building the Dashboards in Kibana
Create a data view first: open Stack Management, choose Data Views, and create one
for test-results-* with @timestamp as the time field. Then create a dashboard and add
panels with Lens, Kibana's drag-and-drop chart builder. These are the panels I start with:
| Panel | Chart | Configuration |
|---|---|---|
| Pass rate over time | Line | X: @timestamp. Y: the formula count(kql='status : "passed"') / count() shown as a percentage |
| Failures by layer | Stacked bar | X: @timestamp. Y: count with filter status : "failed". Break down by layer |
| Top failing tests | Table | Rows: top values of test.name. Metric: count with filter status : "failed" |
| Flakiest tests | Table | Same as above with filter status : "flaky" |
| Slowest tests | Horizontal bar | Rows: top values of test.name. Metric: average of duration_ms |
| Failure causes | Donut or bar | Slice by top values of error.type, filtered to failed results |
| Release quality | Bar | X: top values of run_id. Y: pass-rate formula. Compare the latest runs side by side |
Add filter controls for application, environment, and branch at the top of the
dashboard. You can also type KQL in the search bar, for example
application : "summit-trust-bank" and environment : "qa" and layer : "ui".
Save as
assets/img/articles/kibana-quality-overview.png
Save as
assets/img/articles/kibana-failing-and-flaky-tests.png
run_id values.Save as
assets/img/articles/kibana-release-quality.png
Making the Numbers Trustworthy
A dashboard that people do not trust gets ignored. These practices keep the data honest:
- Keep test identities stable. If you rename a test, its history starts over. Use consistent names and suites.
- Do not mix environments. A failure in QA and a failure in a developer's local run mean different things. Always set
environmentand filter on it. - Count skipped tests separately. A rising number of skips can hide a falling pass rate. Treat
test.fixmeand skipped tests as visible debt. - Publish failed runs too. Run the publisher with
when: always, and publish retries so flakiness shows up. - Make re-publishing safe. The deterministic
_idabove means a retried job overwrites rather than duplicates. - Pick metrics that drive decisions. I use pass rate, flaky-test count, and failures by cause. A dozen vanity charts hide the three that matter.
Security and Operations
- Use a scoped API key. Give the publisher an API key whose role can only create indices and write to
test-results-*. Never use an admin credential in CI. - Turn security on outside your laptop. The local Compose file disables it. A shared cluster needs authentication and TLS.
- Set a retention policy. An index lifecycle management (ILM) policy can delete results older than, say, 180 days so the cluster does not grow forever.
- Alert on regressions. Kibana alerting rules can notify a channel when the pass rate falls below a threshold or a new test starts failing.
- Mind what you store. Error messages can contain tokens or personal data. Scrub them in the adapter before indexing.
Takeaways
- Indexing every test result gives you history, and history is what makes trends, flakiness, and release comparisons possible.
- One document per test result, with context such as application, layer, environment, and run, supports almost any question you will ask later.
- A small adapter that reads JUnit XML lets many frameworks feed the same index without changing any test code.
- Start with a few decision-driving panels, keep the data trustworthy, and secure and age out the cluster like any other production system.
For the full reference, see the Elasticsearch documentation and the Kibana documentation.
Back to Articles